Design

Dubai Cyber Index

The Dubai Electronic Security Center measures the cyber maturity of every government entity in Dubai and publishes it as a single monthly score. The platform already existed, it needed a redesign and a much bigger feature set. I led design on the rebuild.

At a glance:

Role: Design Lead

Team: 2 designers, 4 developers, 1 product owner

Scope: Product strategy, UX, UI, design system, AI feature concept

Status: Shipped and in active use · Presented at GITEX Global 2025

man walking in front of textured wall

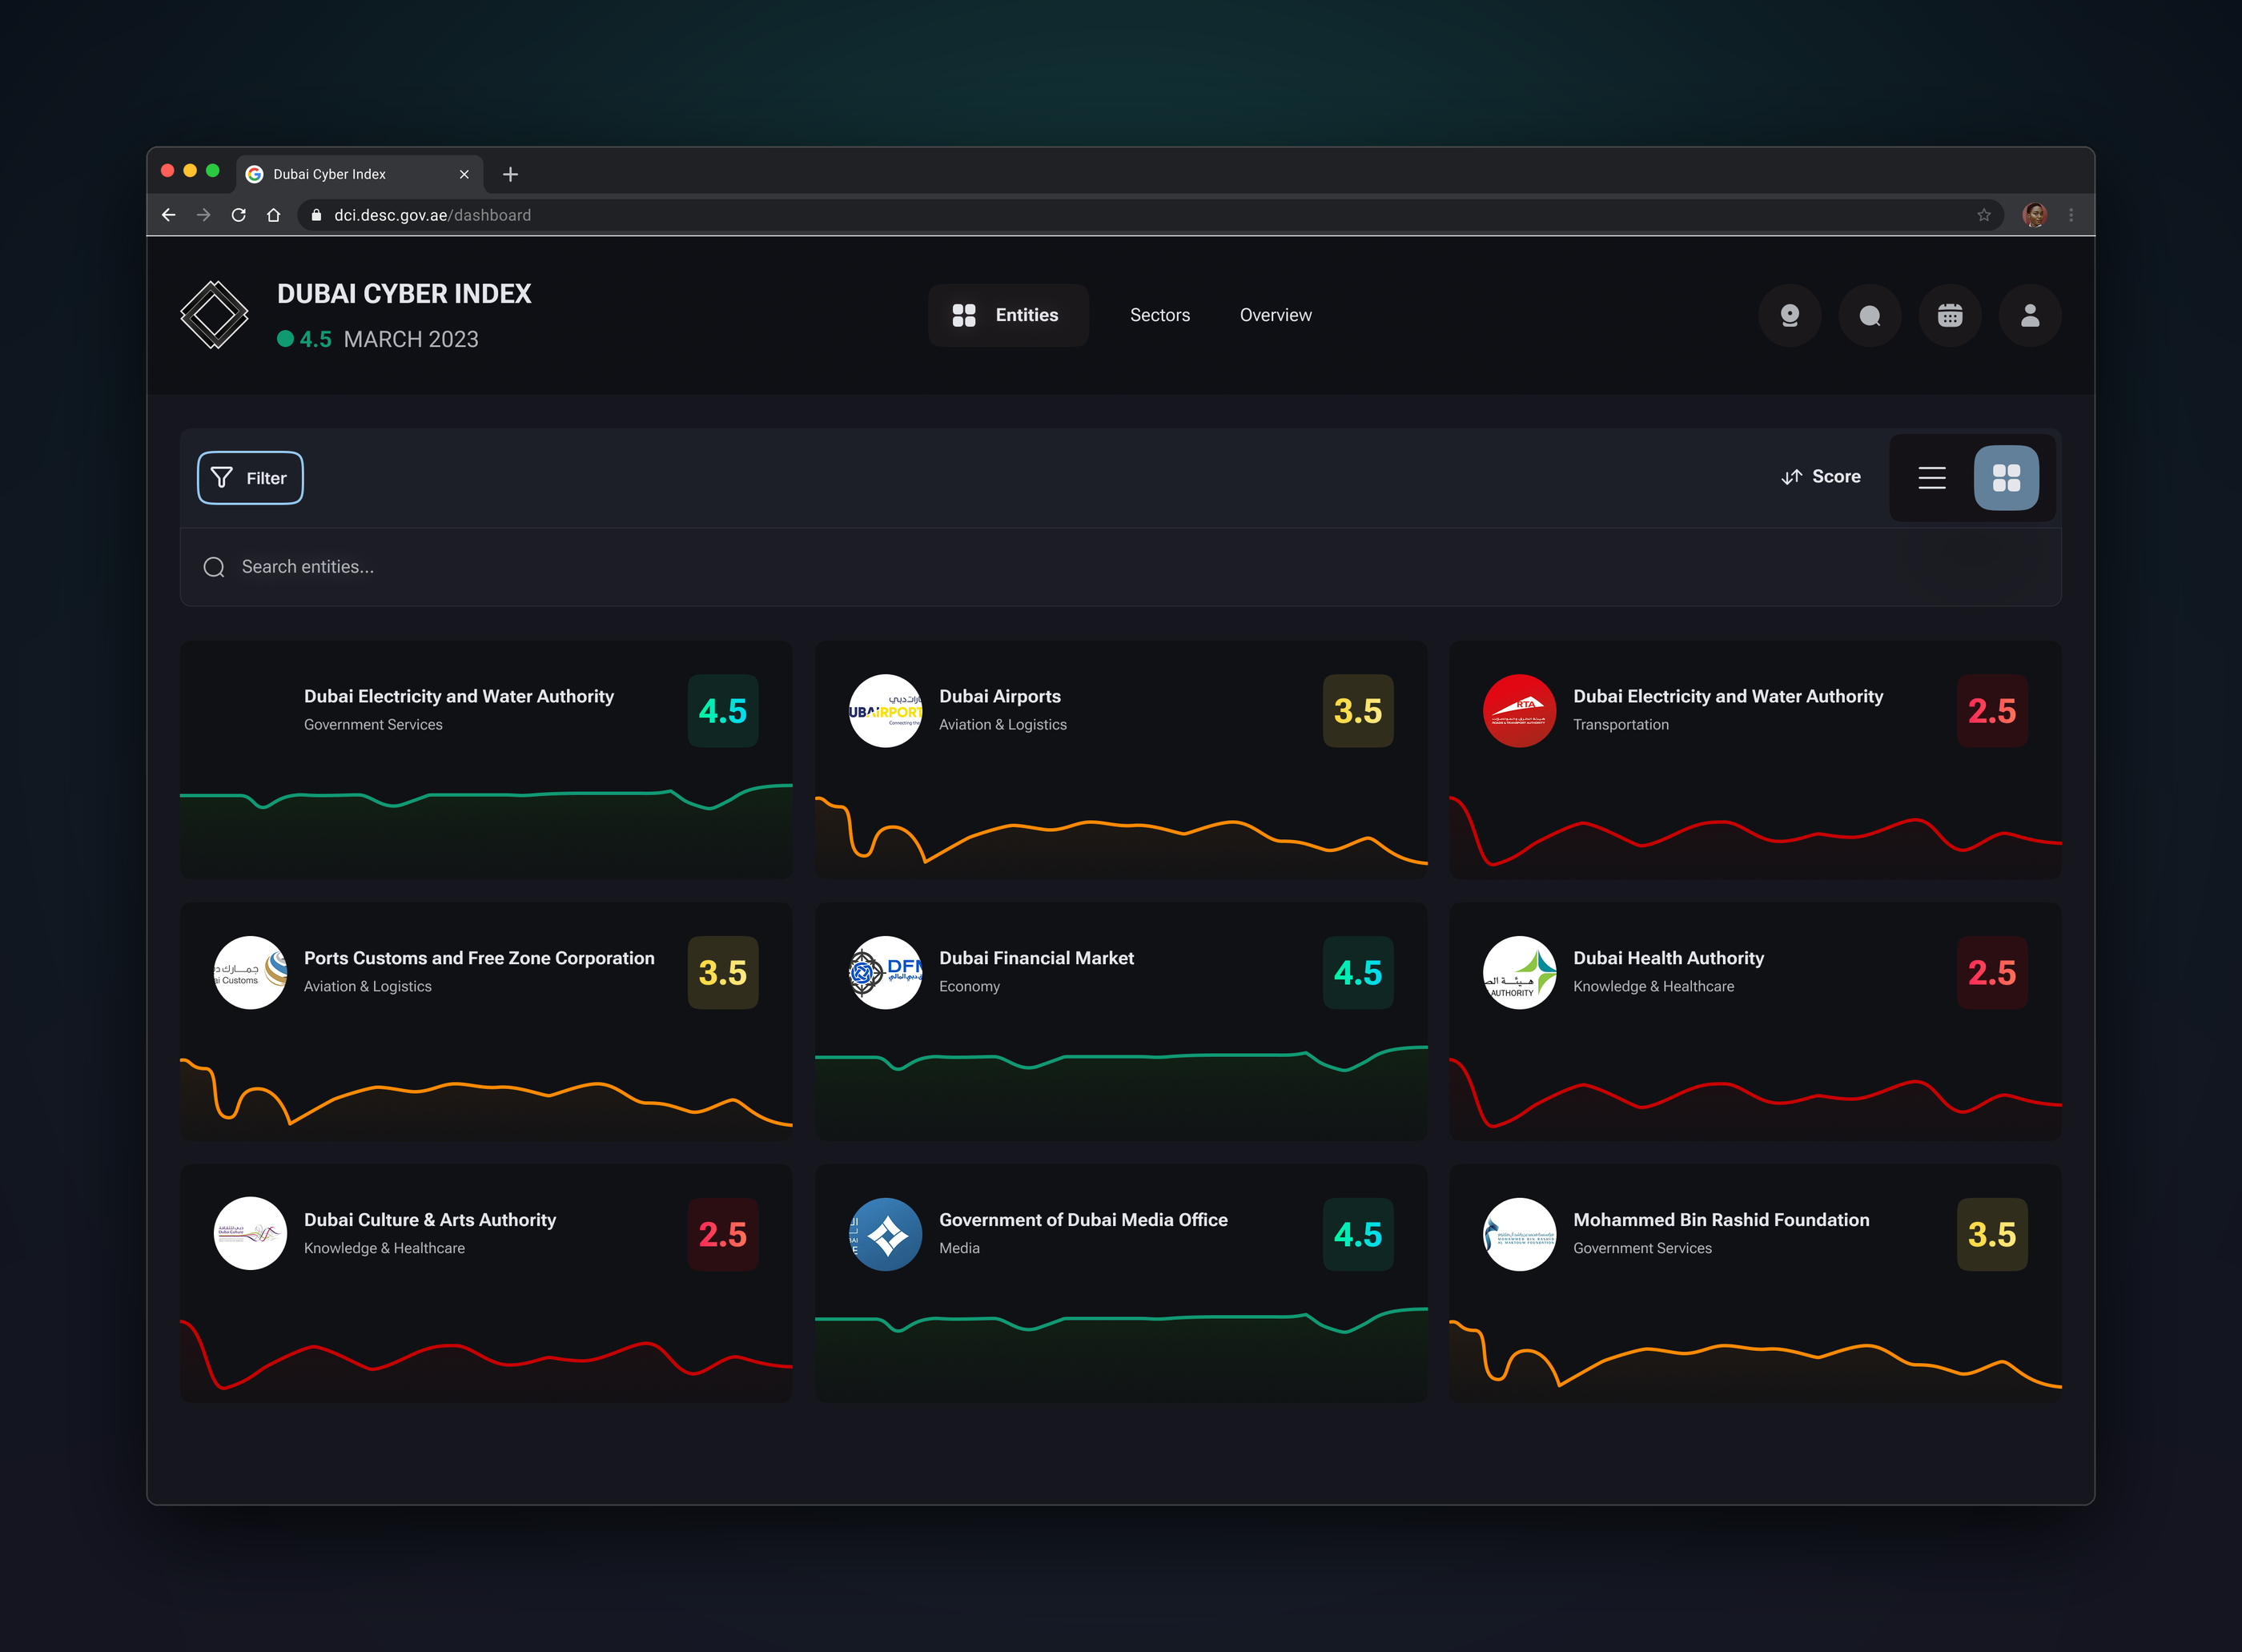
Entities — Every entity with its score and trend. Level and direction, without opening anything.

The problem

Two audiences with opposite needs. Leadership wants the health of the city in about three seconds. The entities themselves log in to find out precisely what to fix. Underneath sits the harder part: six independent security products — Cyber SOC, TIRS, Al Kashif, Taresh, Asaas, Al Maha each producing its own telemetry in its own units, collapsing into one number between 0 and 5. That number had to feel fair to whoever got a bad one. A score you don't trust is a score you ignore.

What I did

One number, then a way down. City score → entity → product → the individual alerts behind it. Every level answers the same two questions at a different resolution, so leadership stops at the top and a security team lives at the bottom.

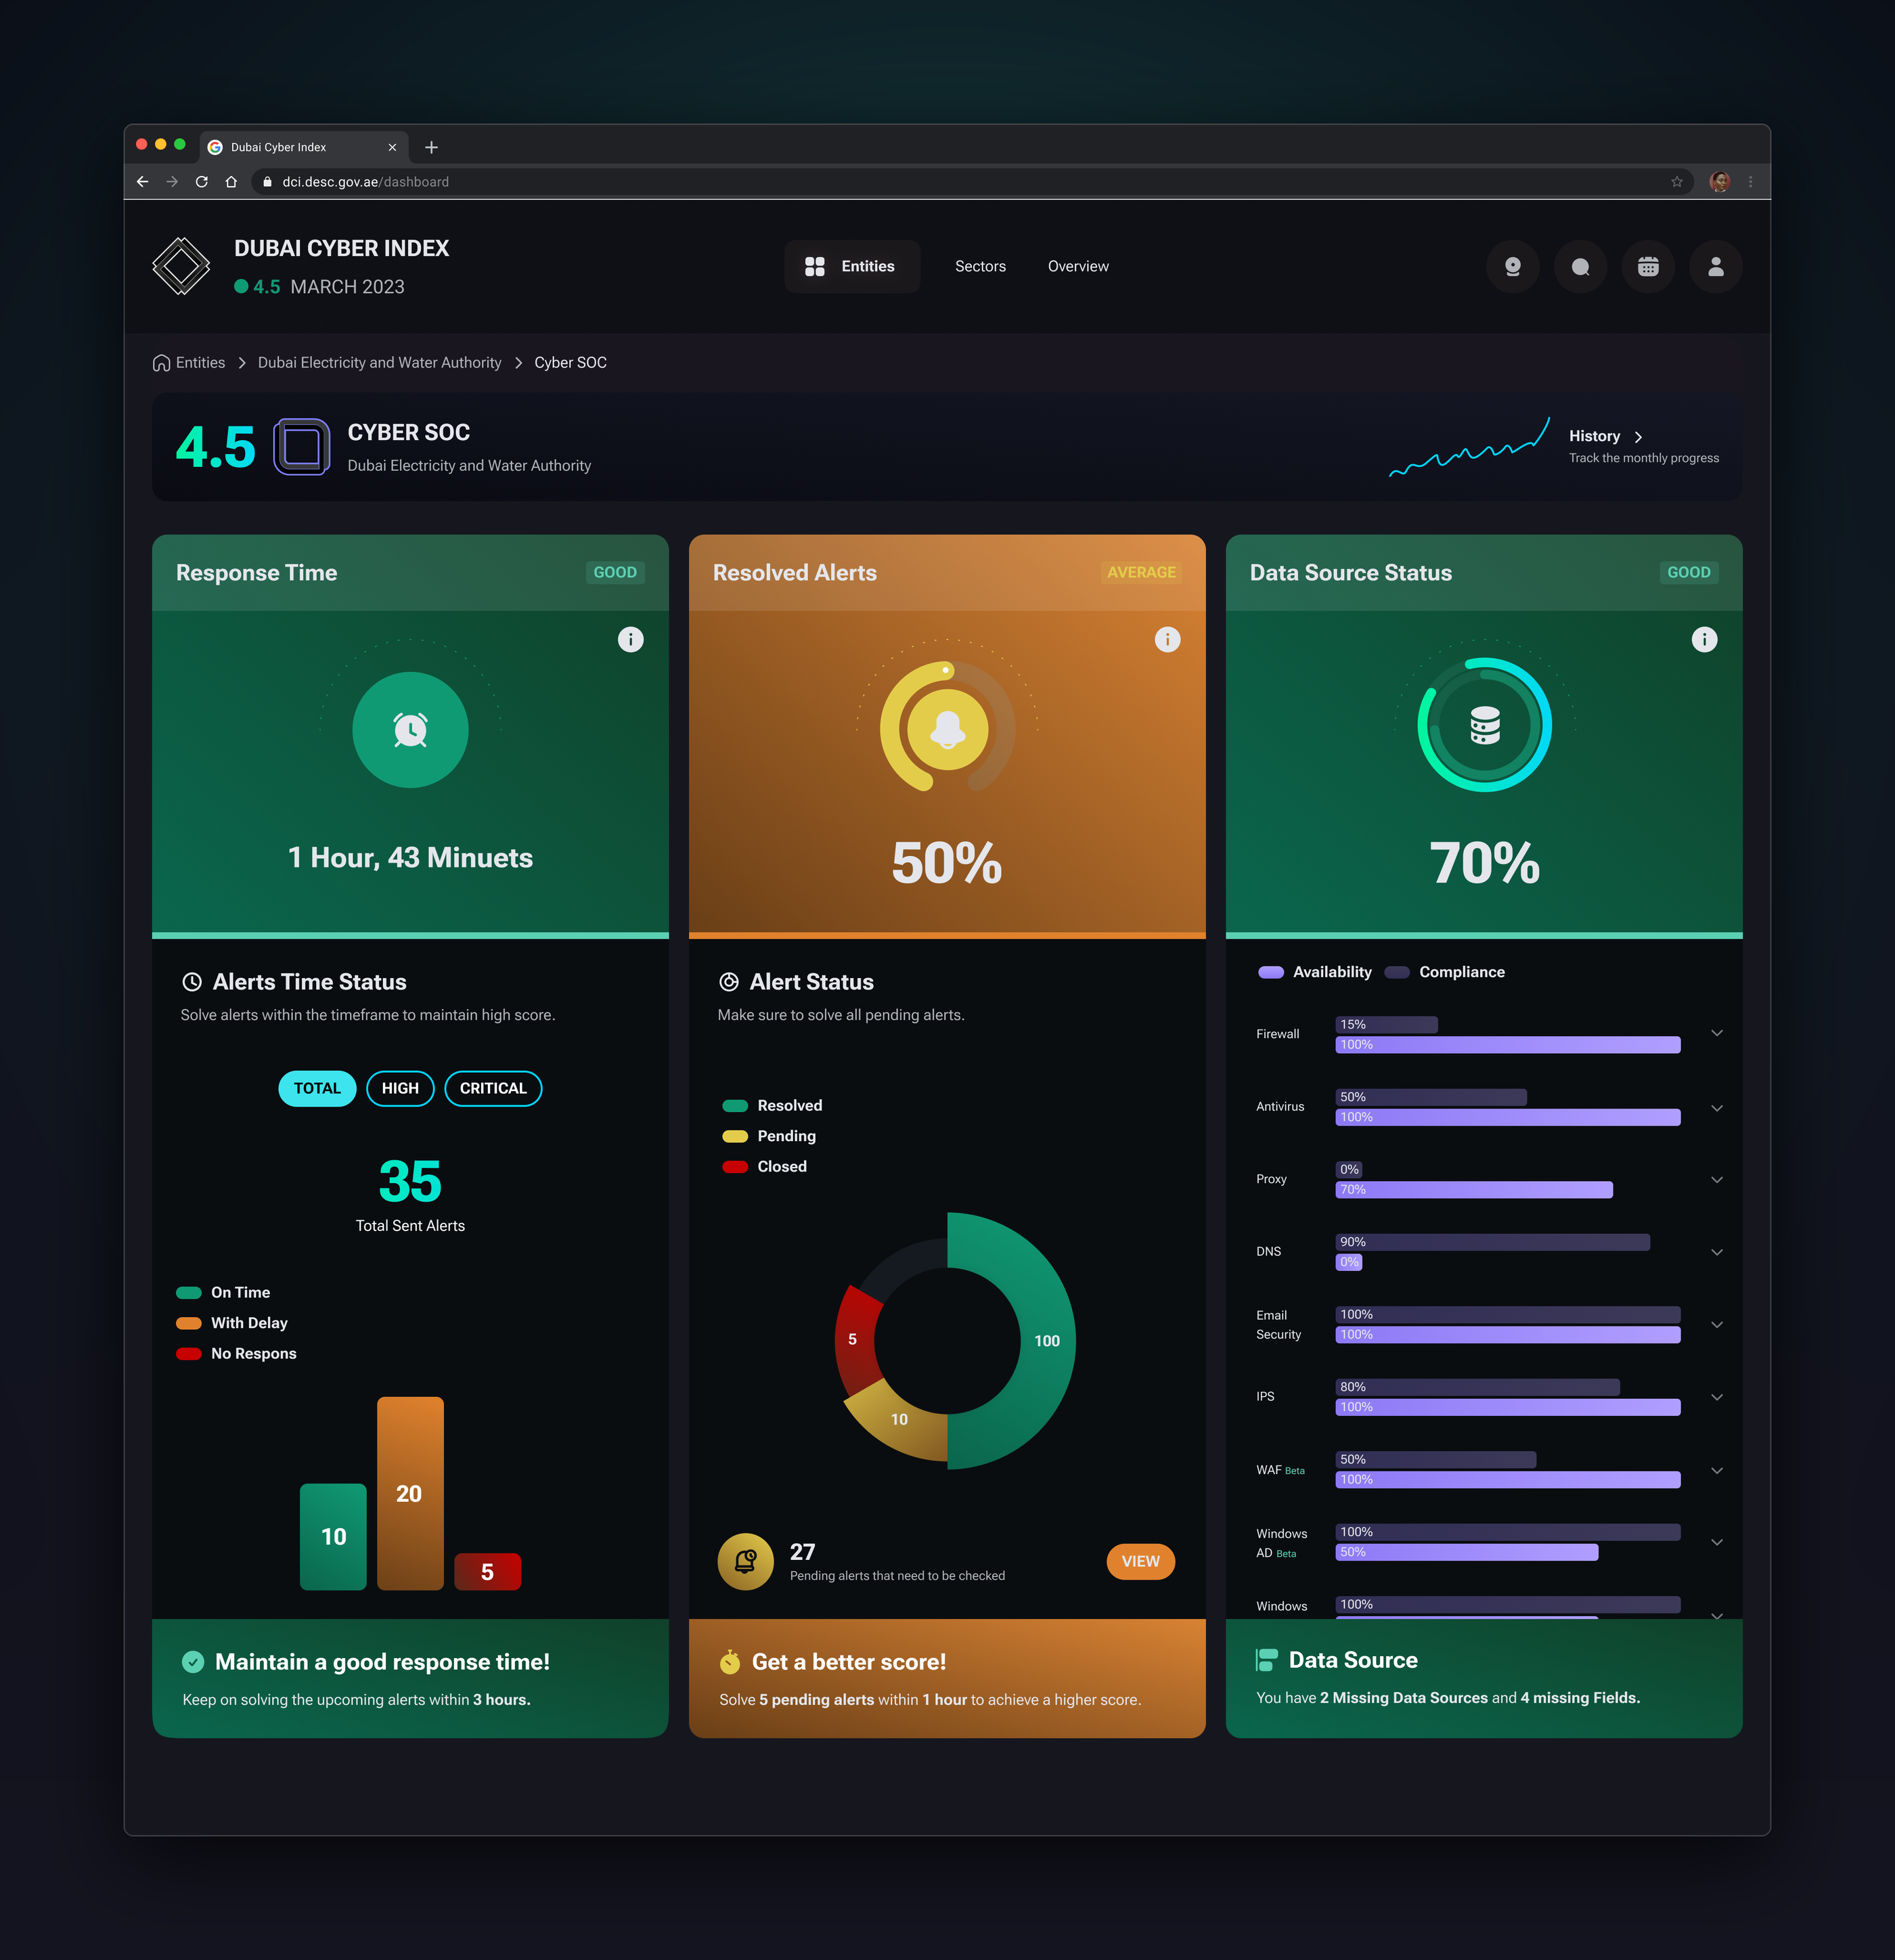
Colour as the system. Good / Average / Poor drives the whole interface, designed as full variants rather than colour swaps. The tonal call mattered: every state resolves into a next action — "Solve 5 pending alerts within 1 hour" — so a poor score reads as a to-do list rather than a verdict.

Enhance Score. My proposal. The platform diagnosed well and prescribed nothing. This reads an entity's posture across all six products, returns prioritised plain-language recommendations, and opens into a conversation so the reasoning can be questioned.

A system, not a set of screens.

With four developers building in parallel against a design of this surface area, the system was the deliverable as much as the screens were.

  • 170 components, 2,825 instances — headers, product cards, score badges and status grades built once and reused everywhere
  • Semantic tokens for colour, a defined type scale, and named elevation, so score states and theming stay consistent by construction rather than by discipline
  • Five responsive breakpoints designed explicitly, from 576px phones to large command-centre displays
  • The unglamorous states, all of them — skeleton loading, empty states, no-data products, error and maintenance pages, invalid auth
  • Annotated hover and interaction specs written directly into the file for handoff
crowd of people on a town square

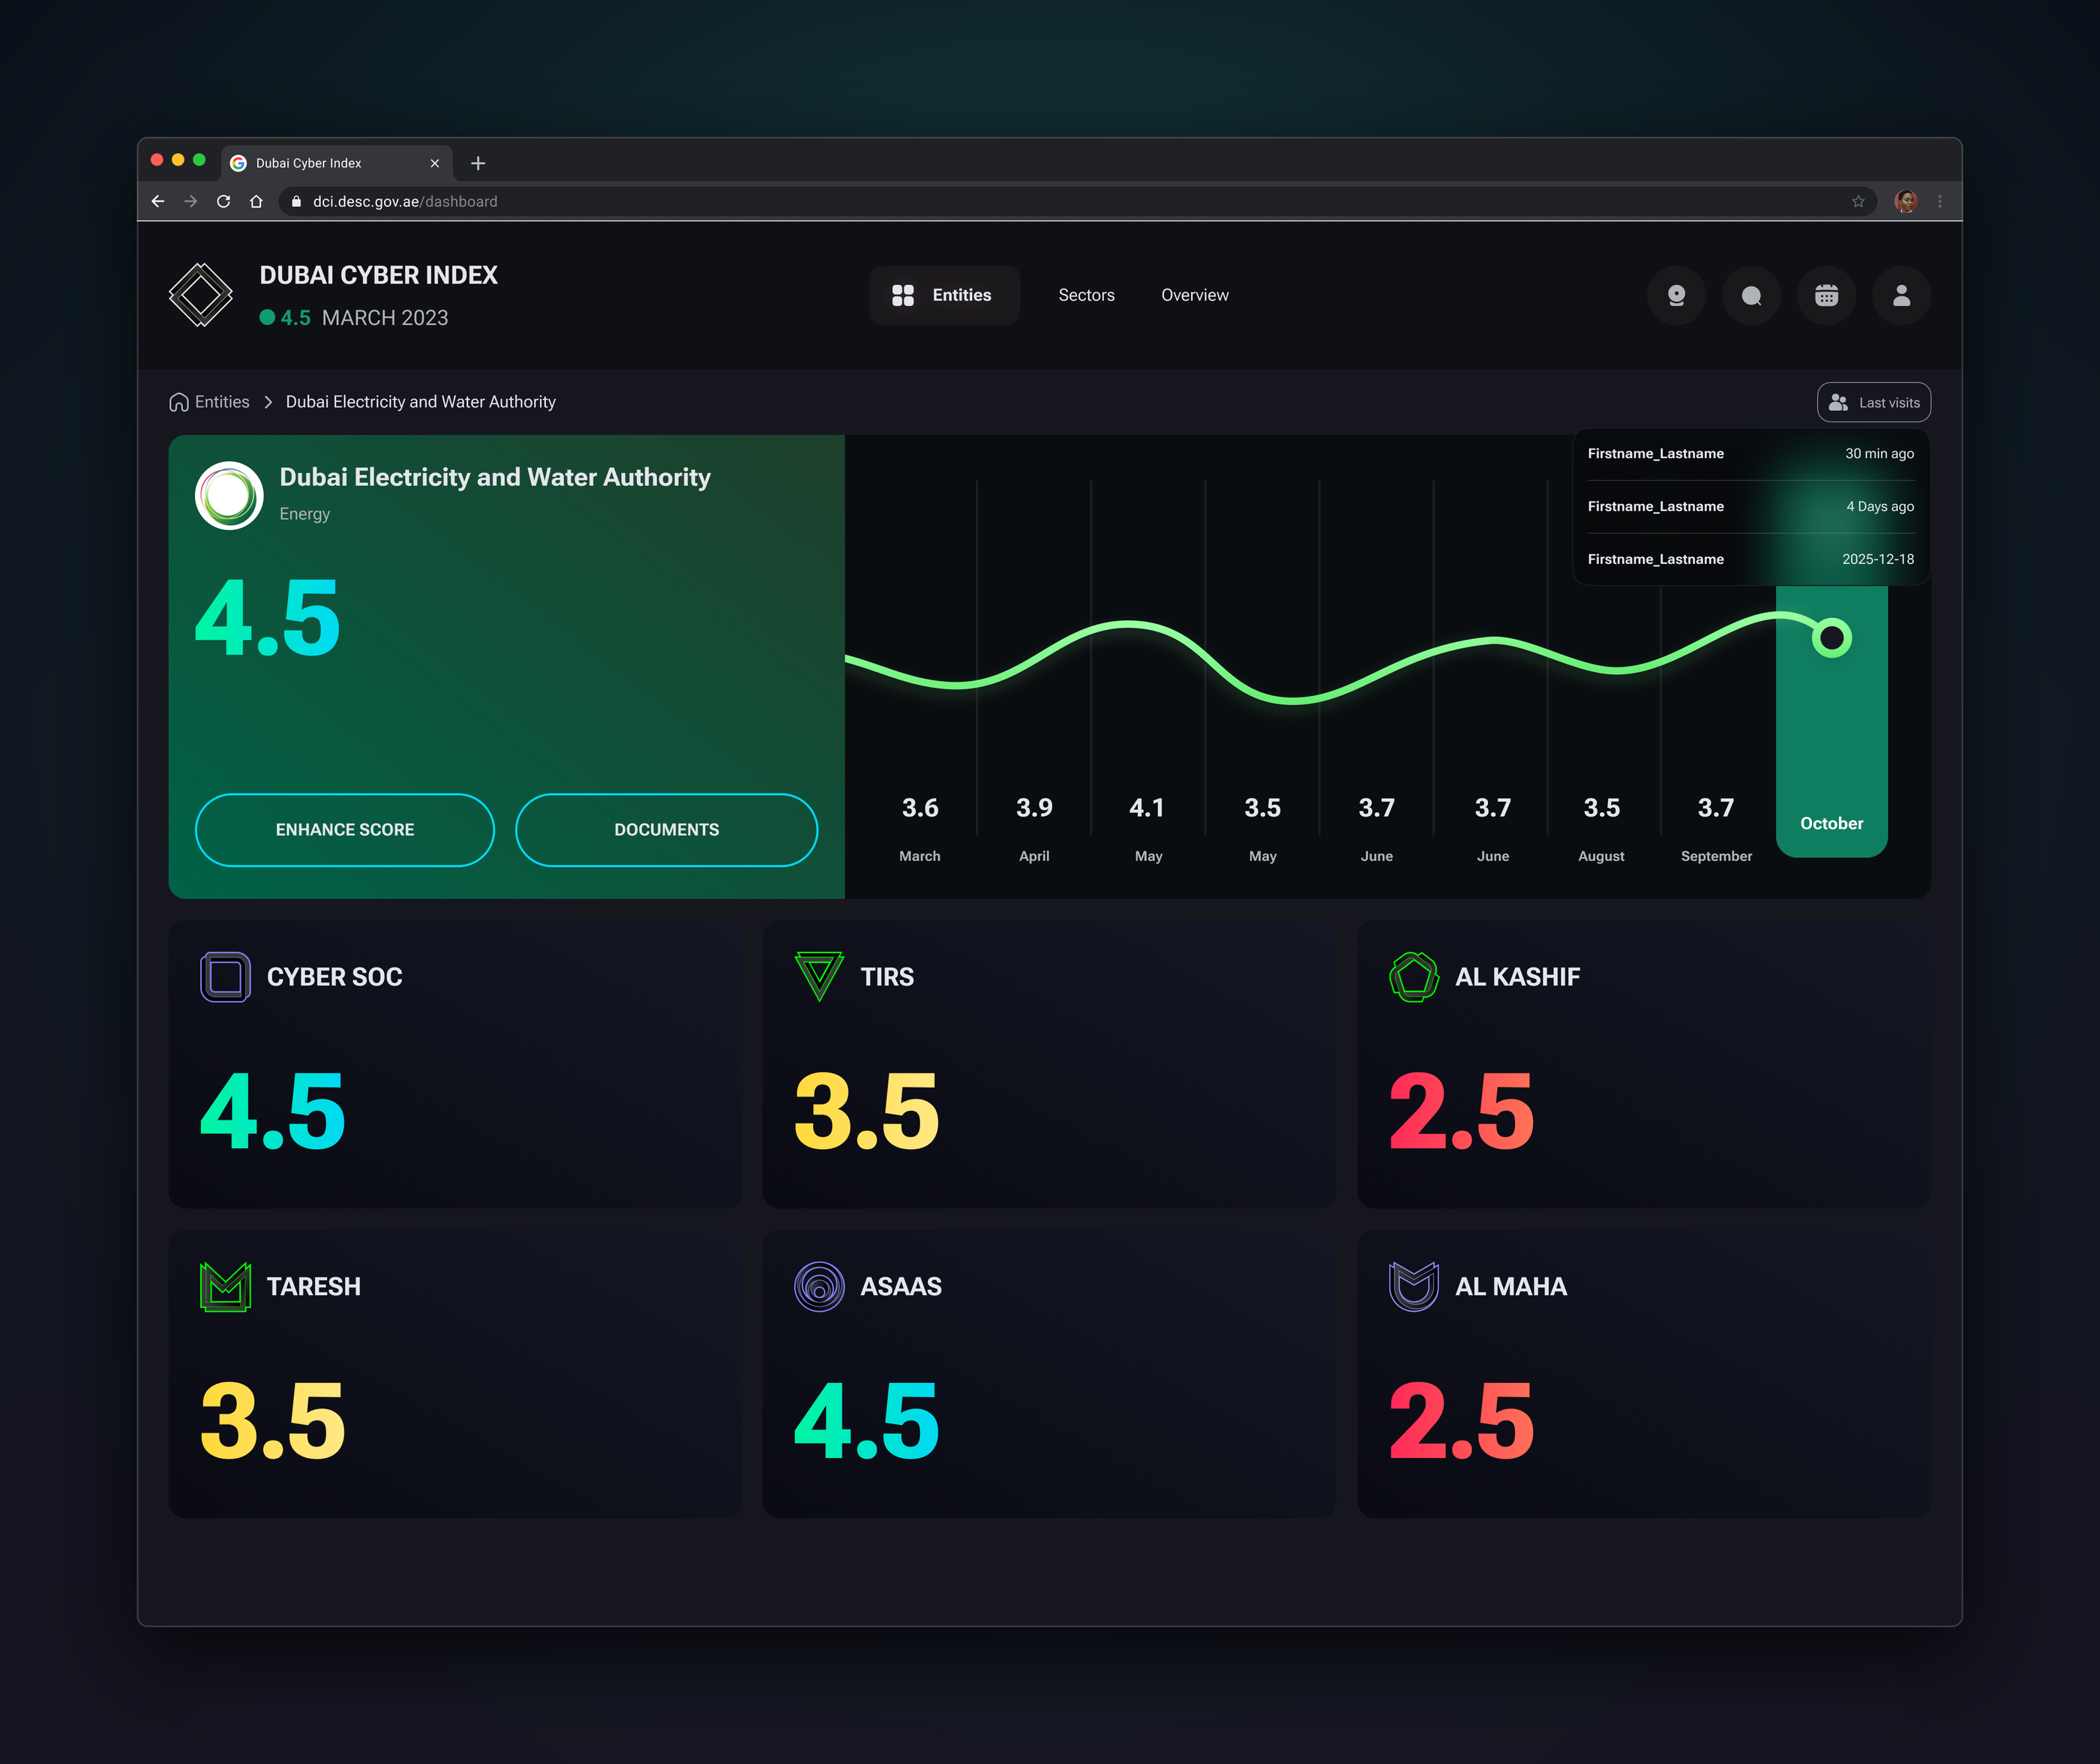
Entity dashboard — Current score, twelve-month trend, and the six products composing it. Where the single number becomes explainable.
crowd of people on a town square

Product dashboard — Cyber SOC — Response time, resolved alerts, data source coverage. Each carries its own state and its own next action.
crowd of people on a town square

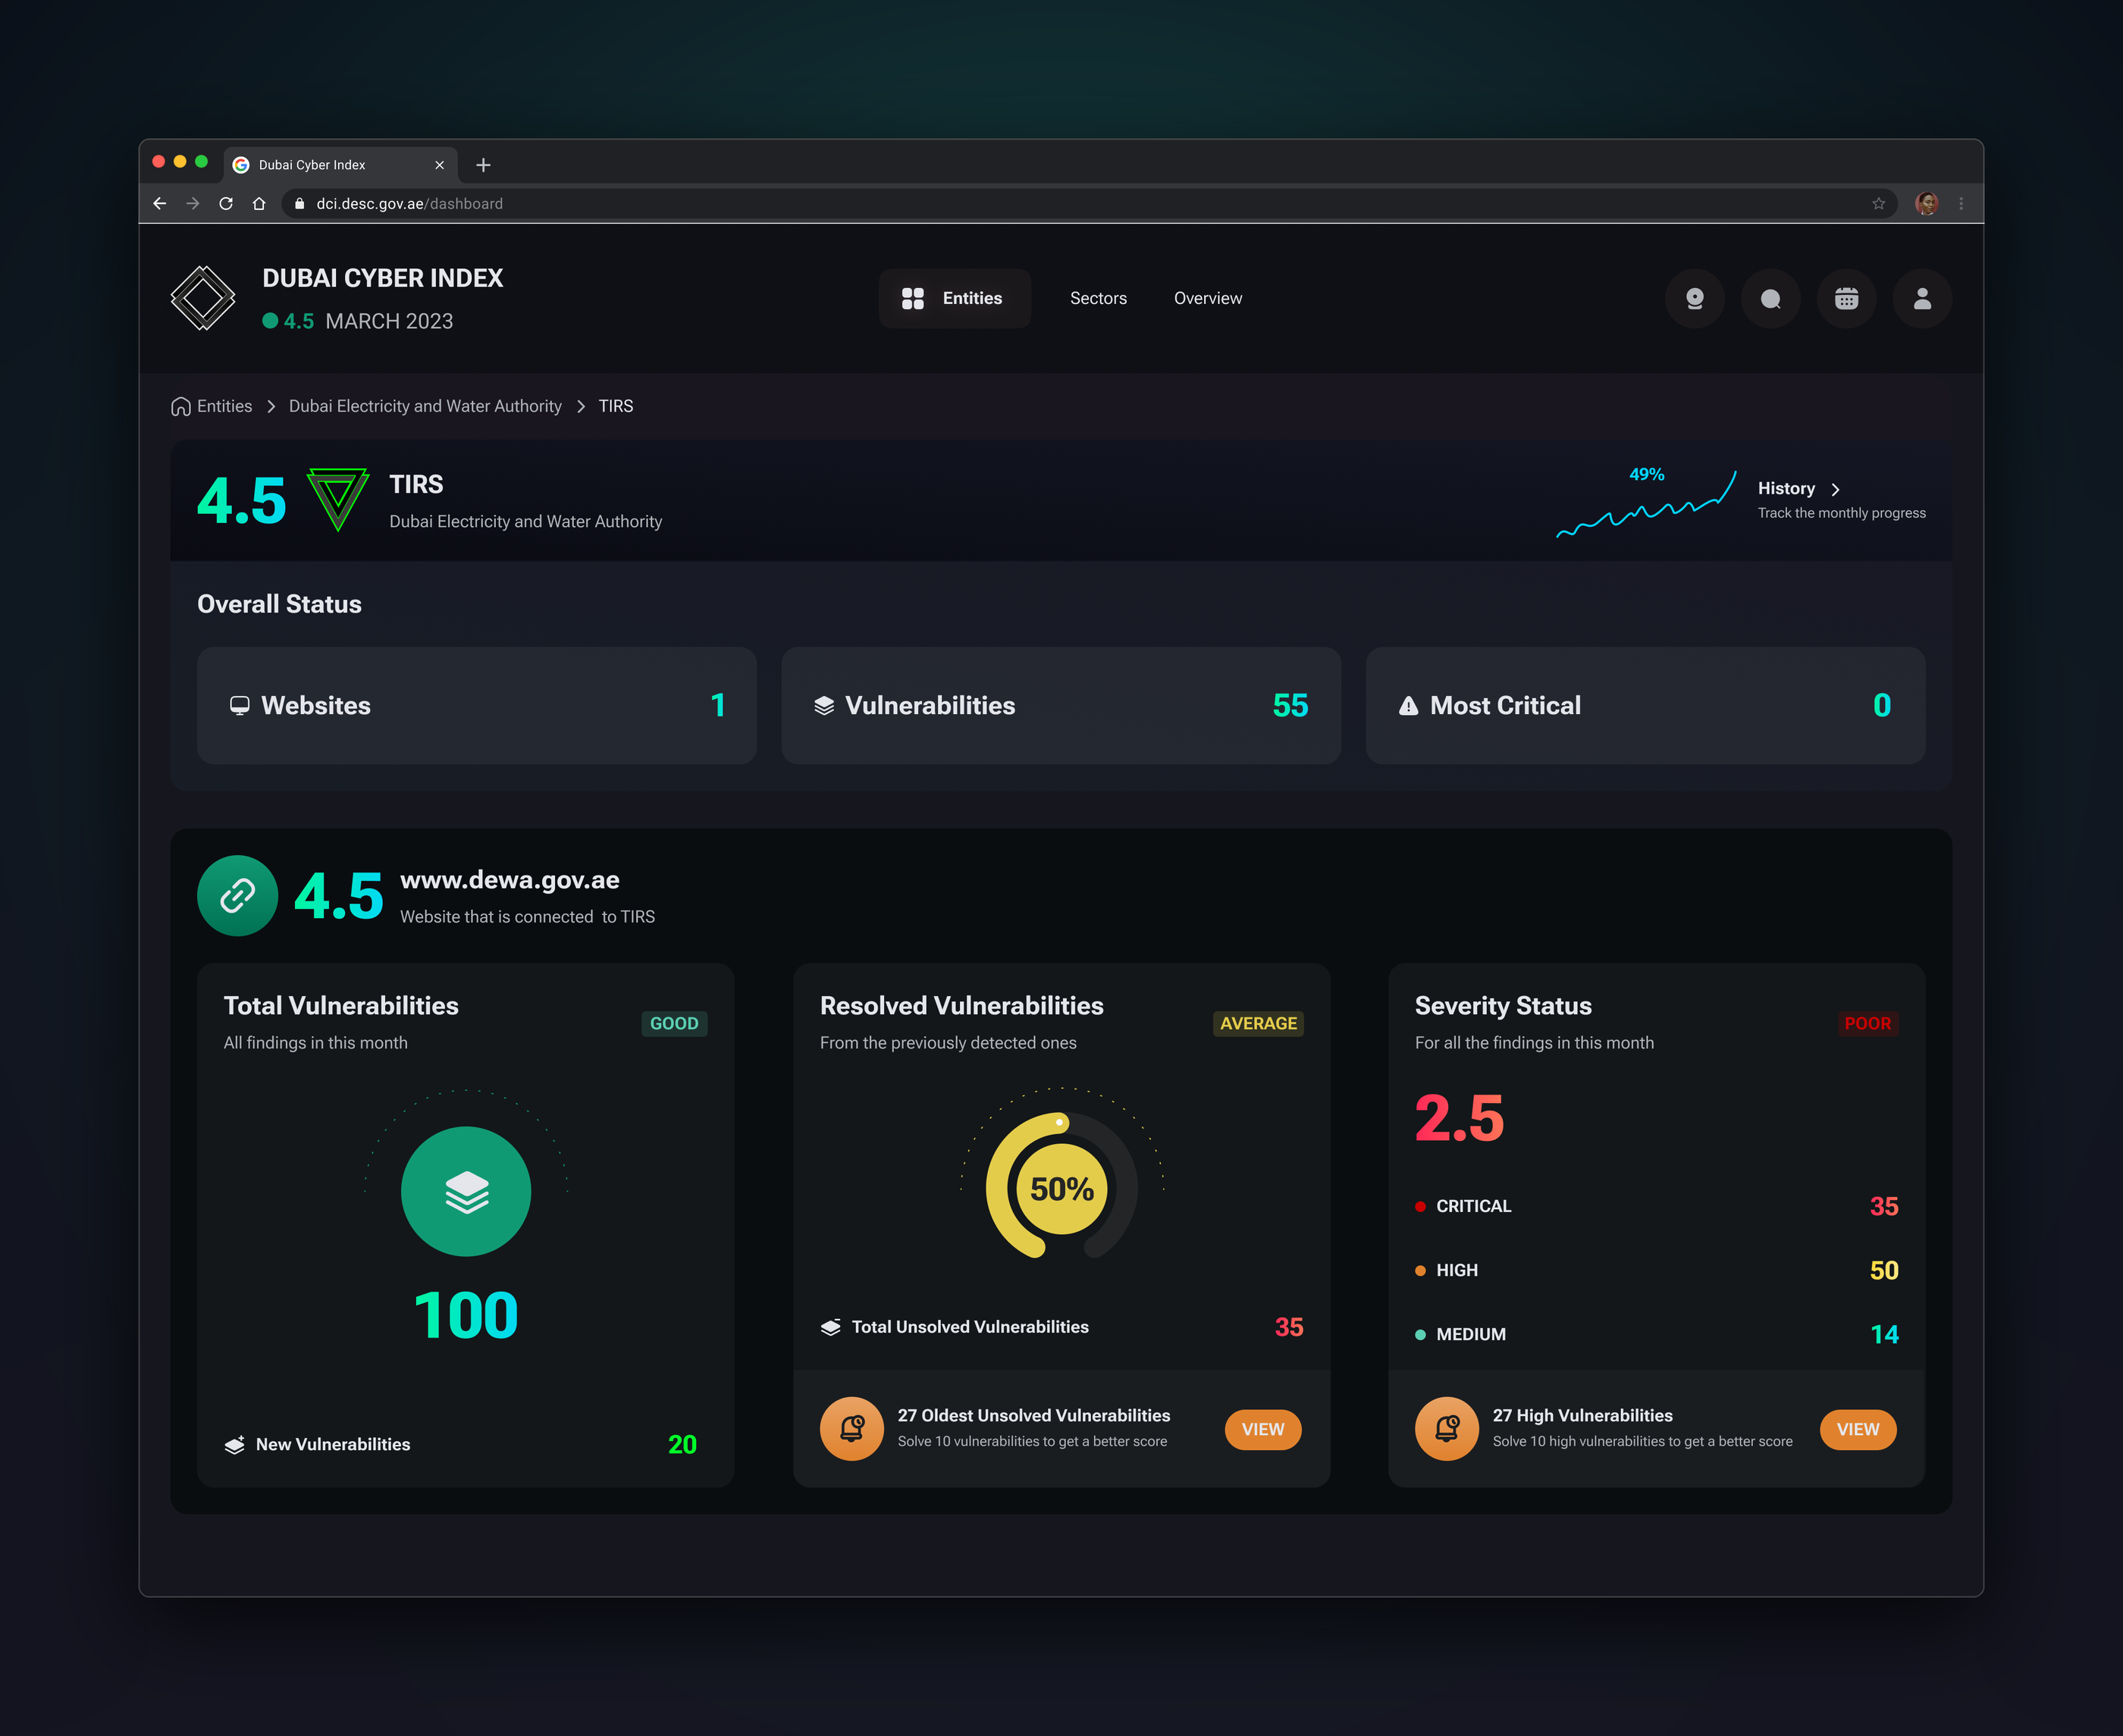
Product dashboard — TIRS — Six products, six data shapes, one widget grammar.
man taking a photo on a wharf

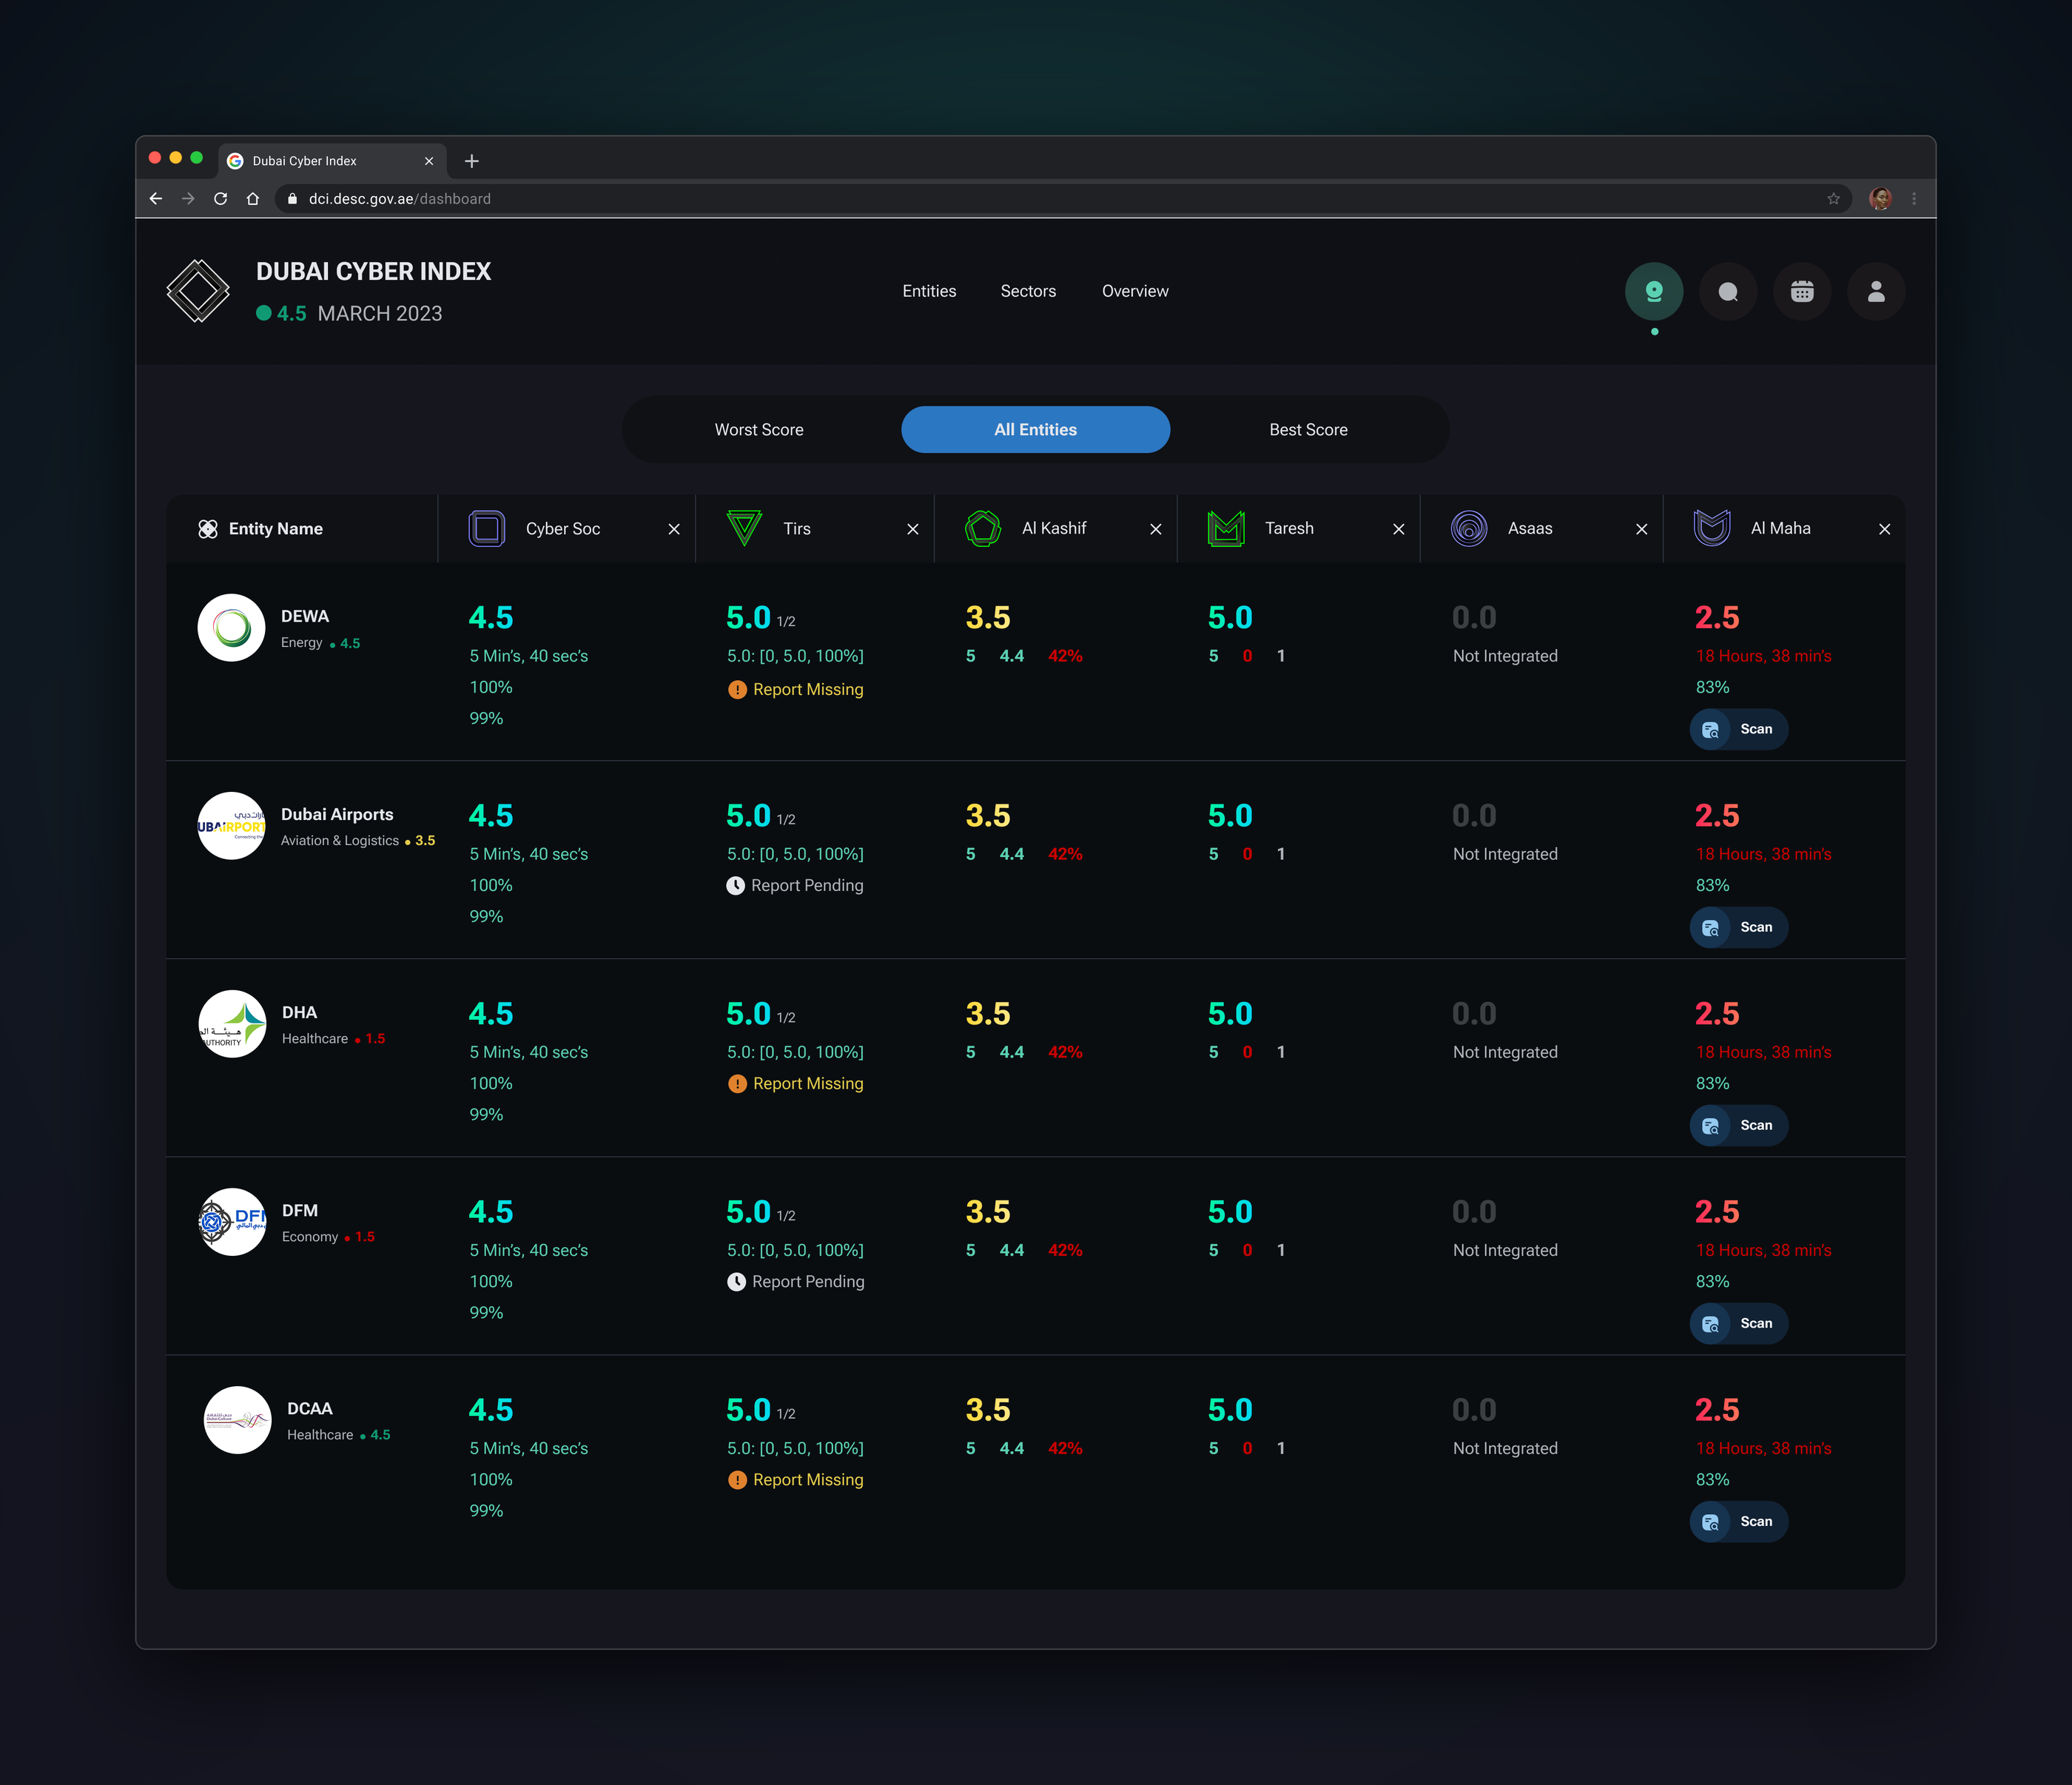
Monitor — Every entity against every product. The densest screen, and the real test of the system.
man taking a photo on a wharf

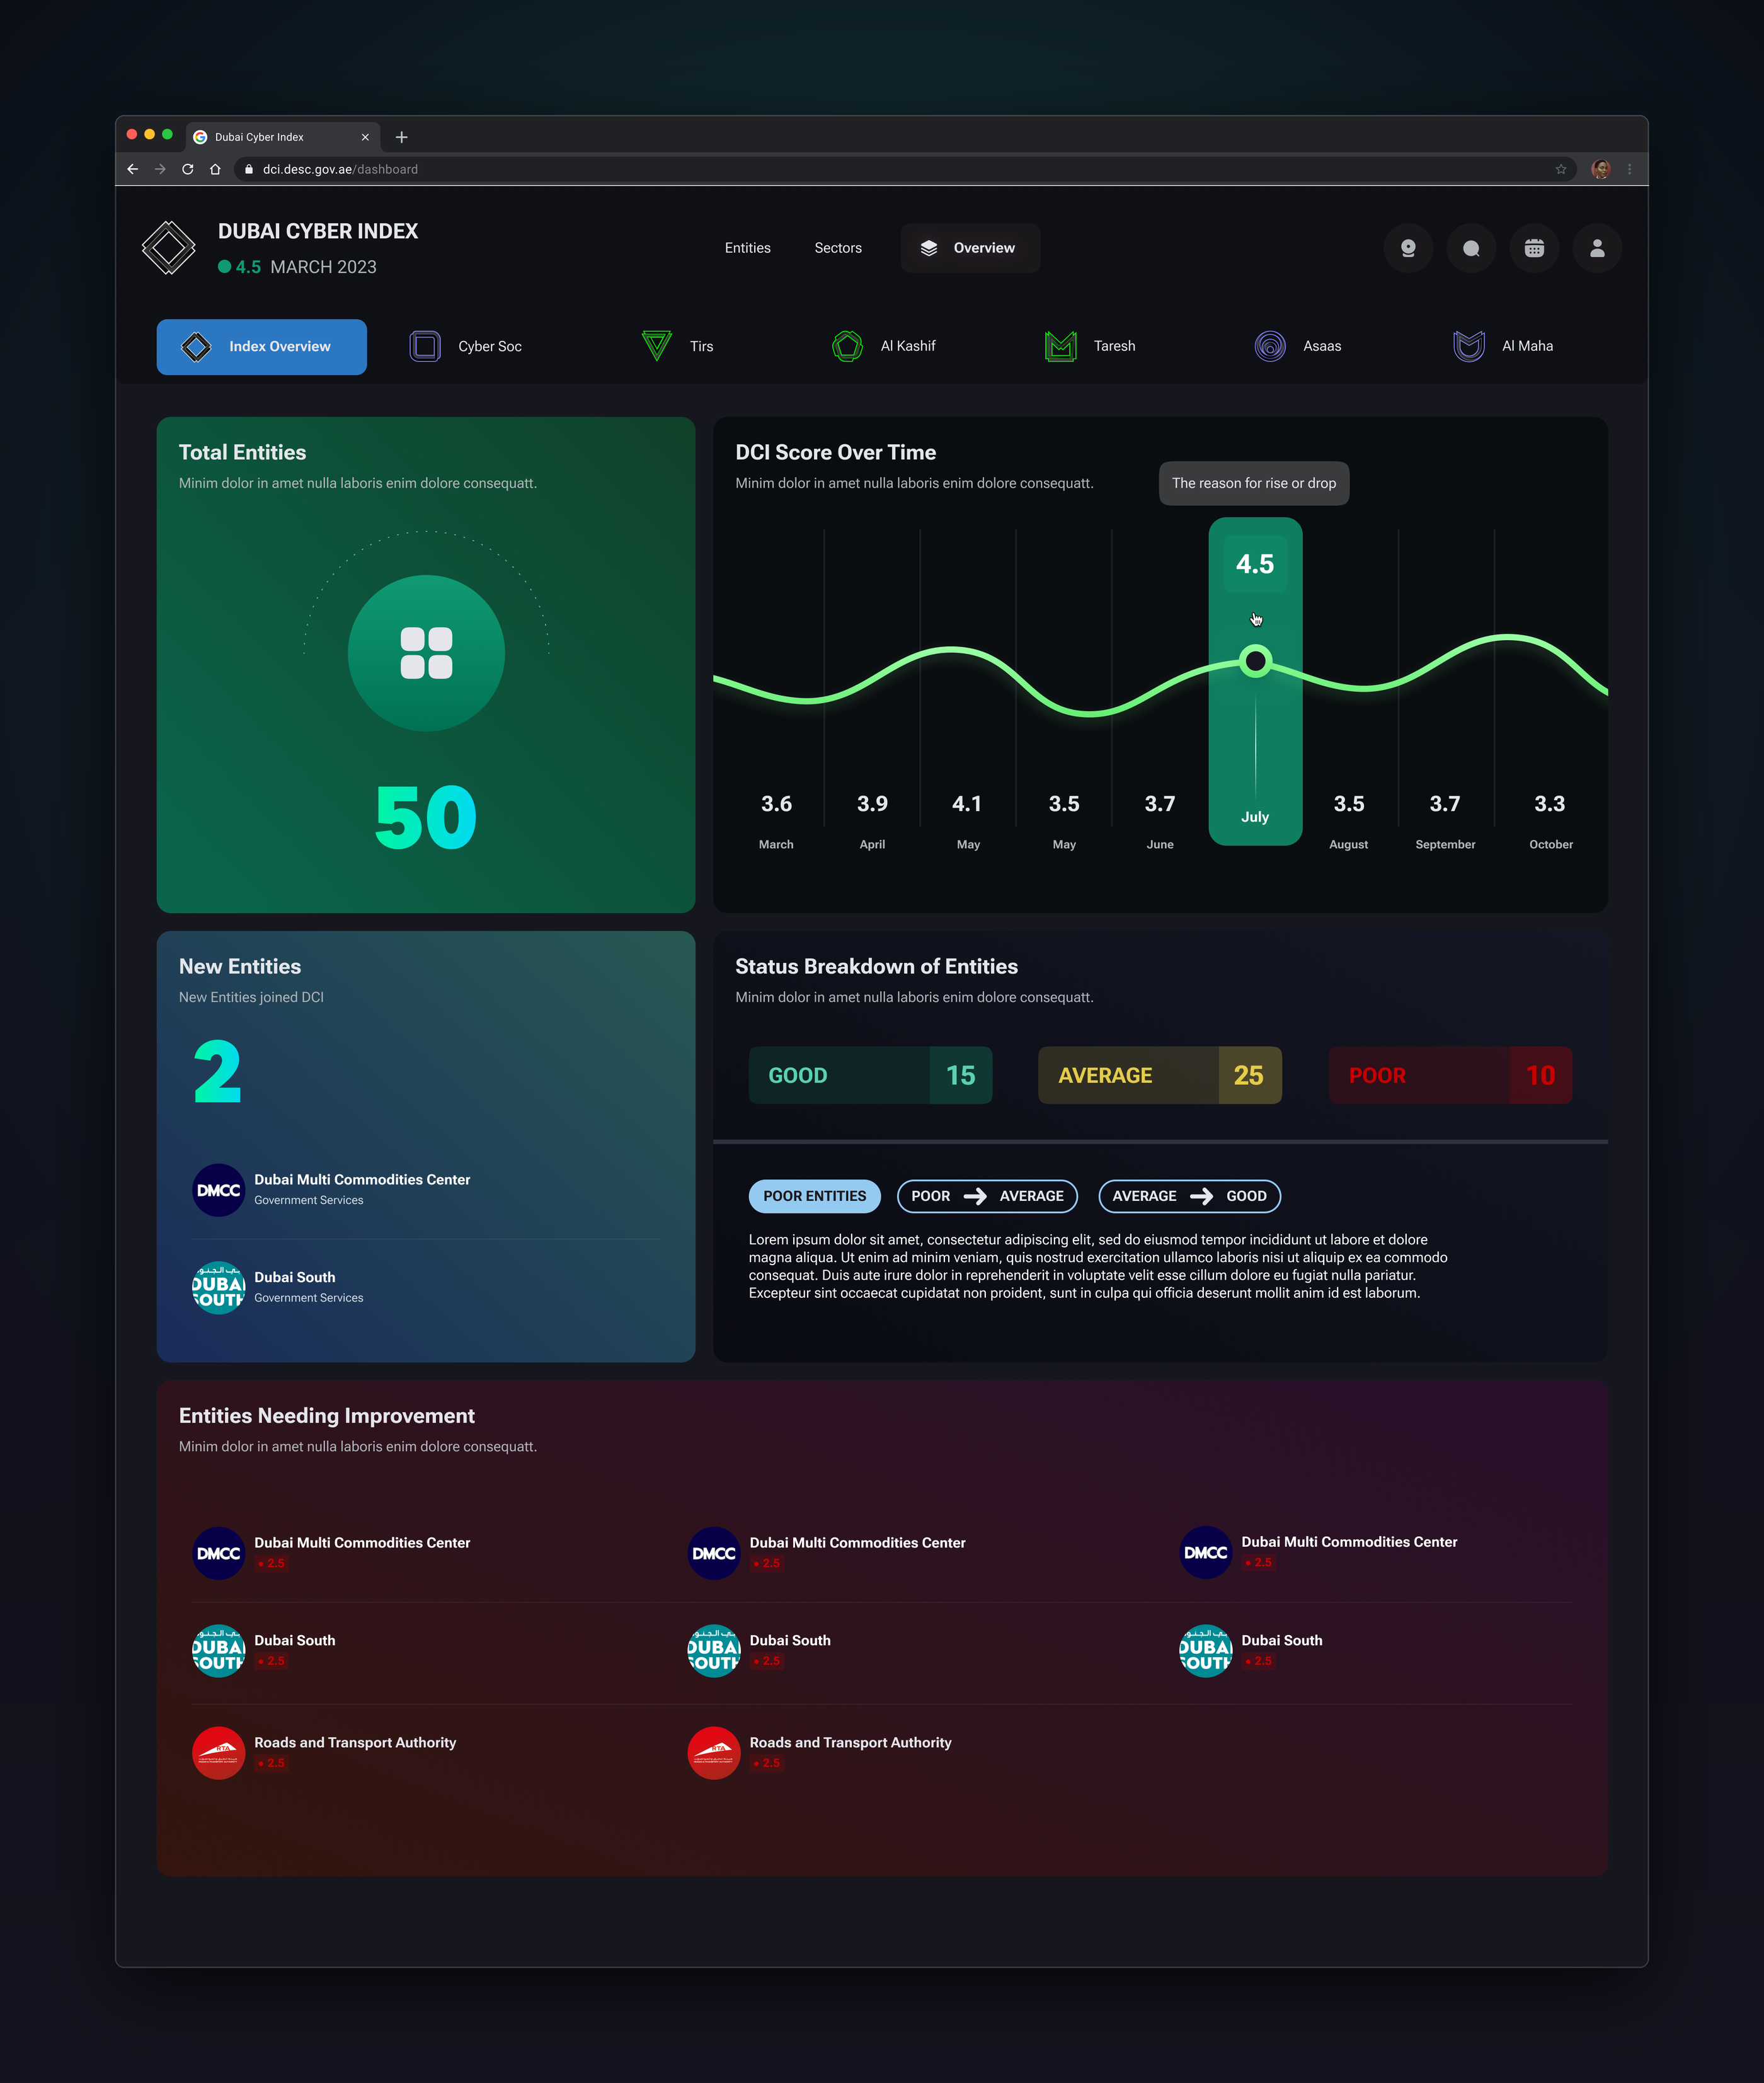
Overview — Performance rolled up by product across the whole index.
man taking a photo on a wharf

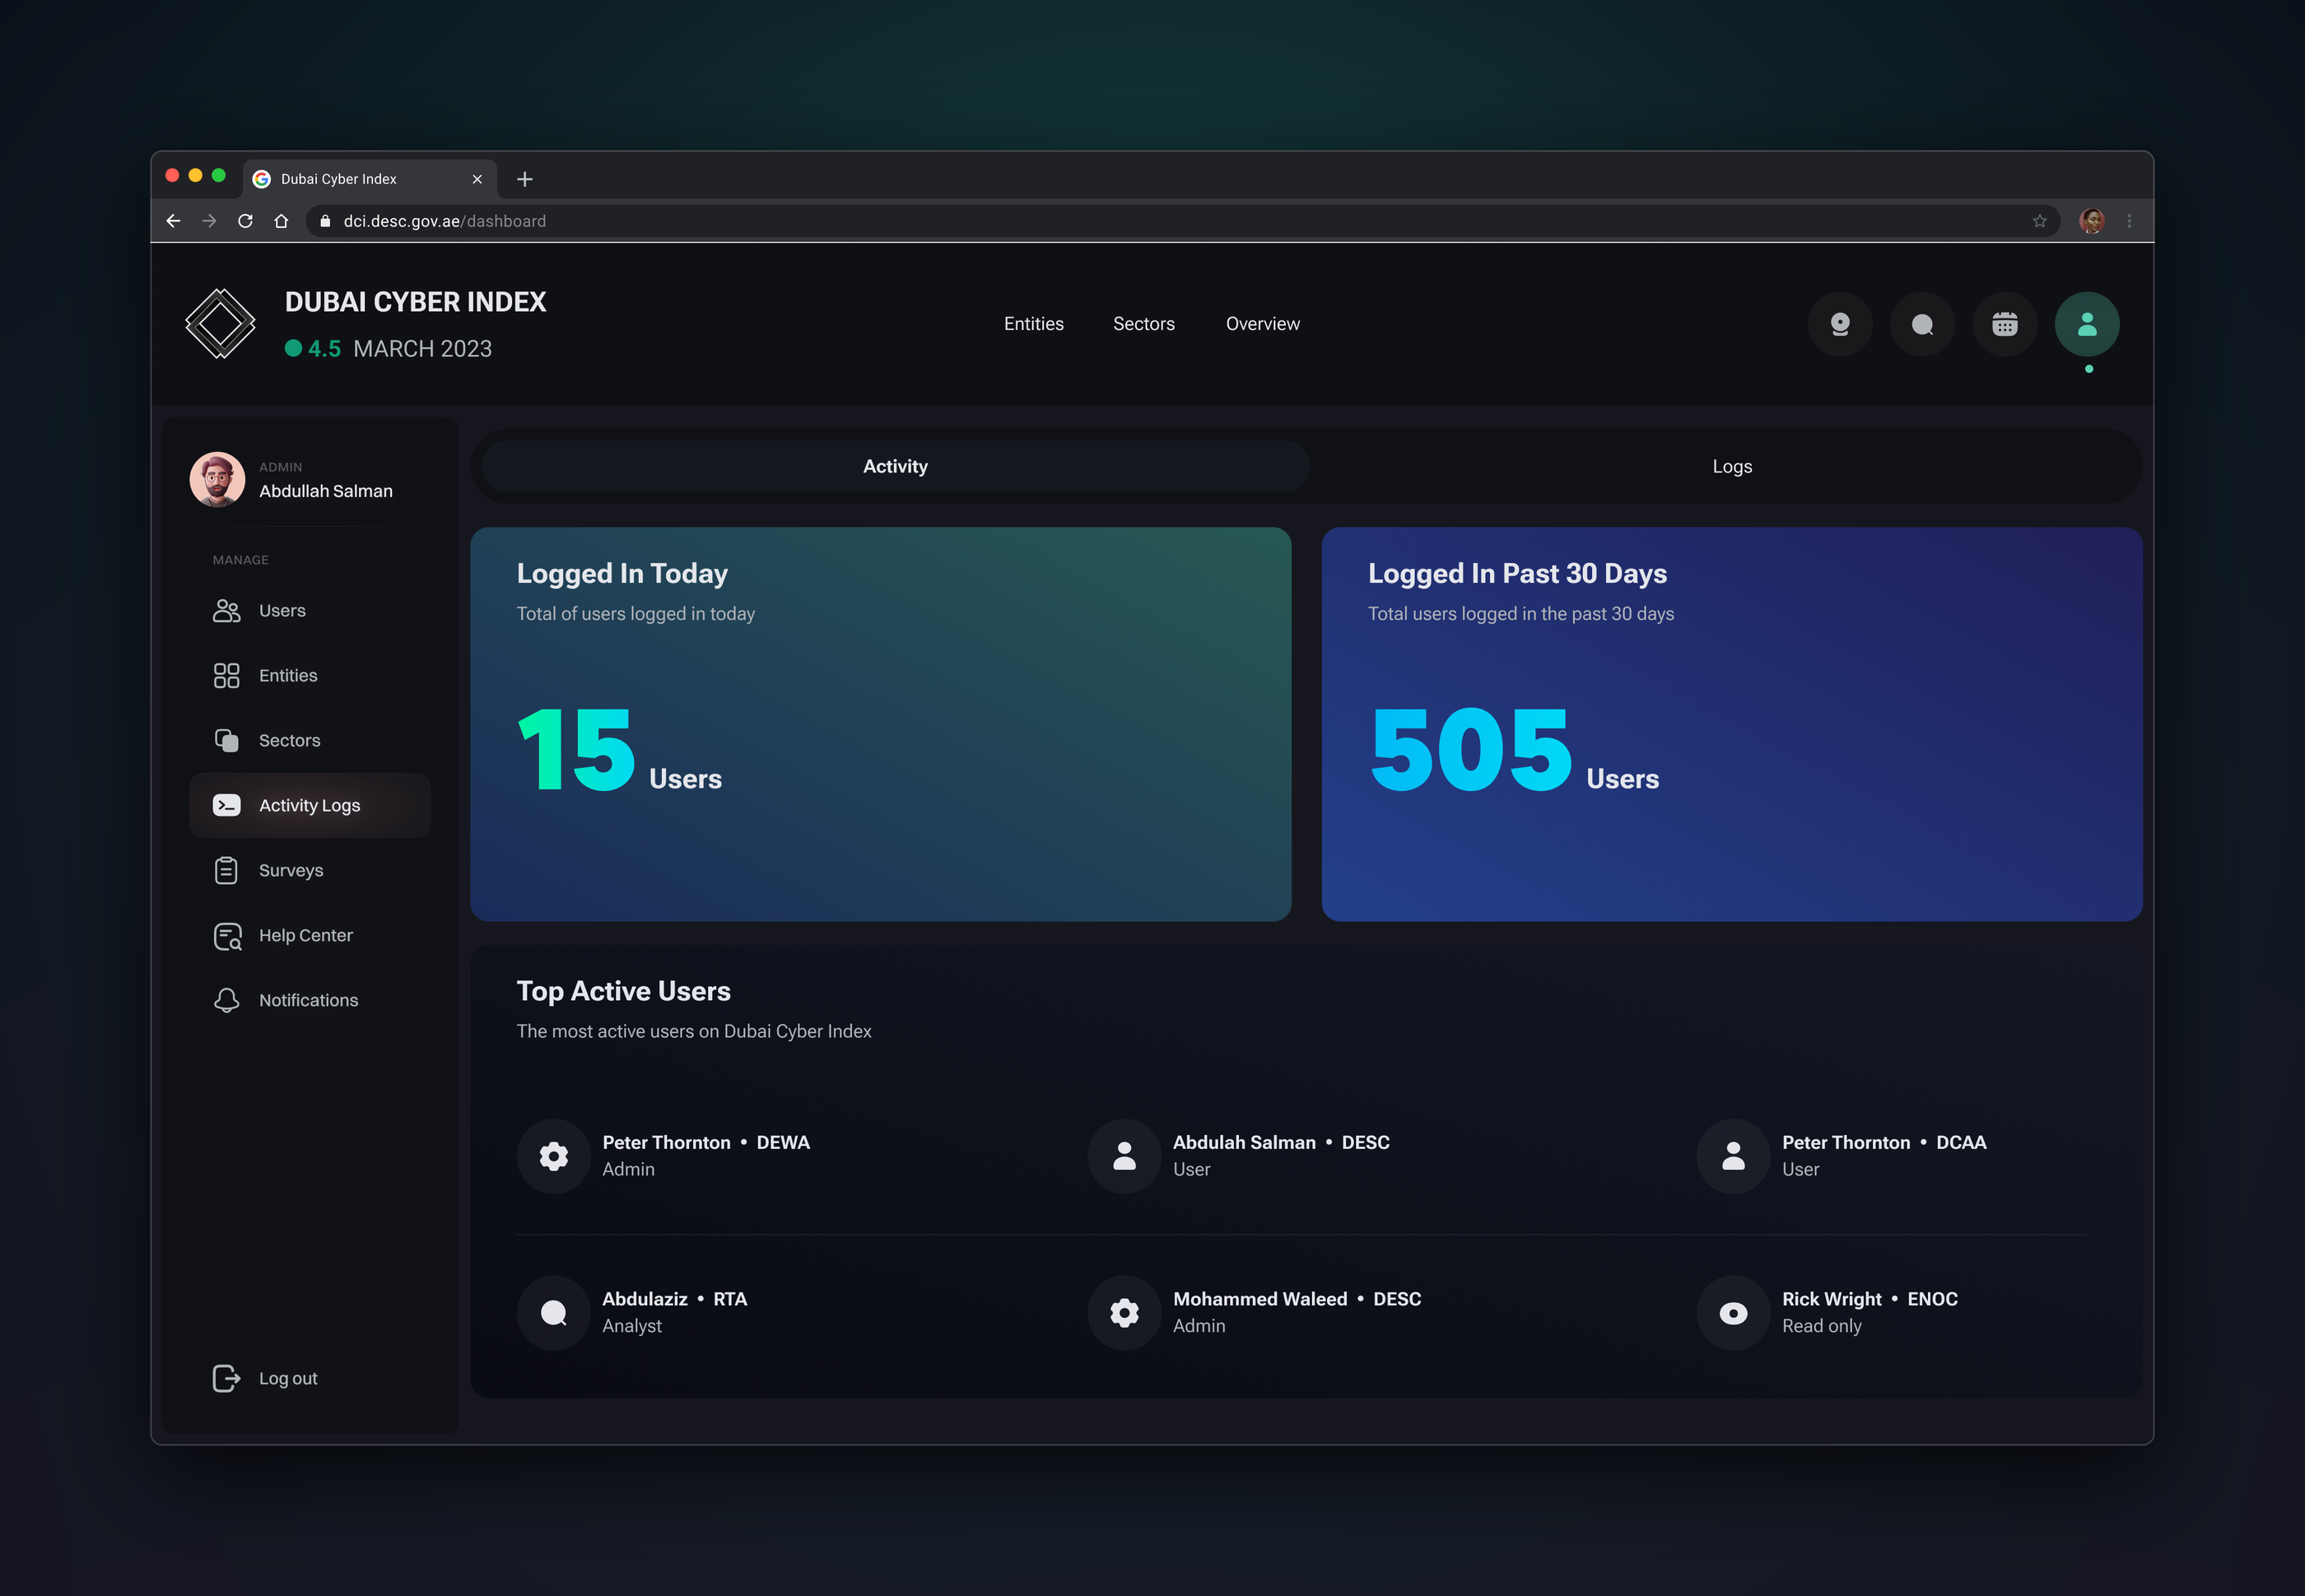
Admin — User management, activity logs and audit trails behind the public-facing product.

Outcome

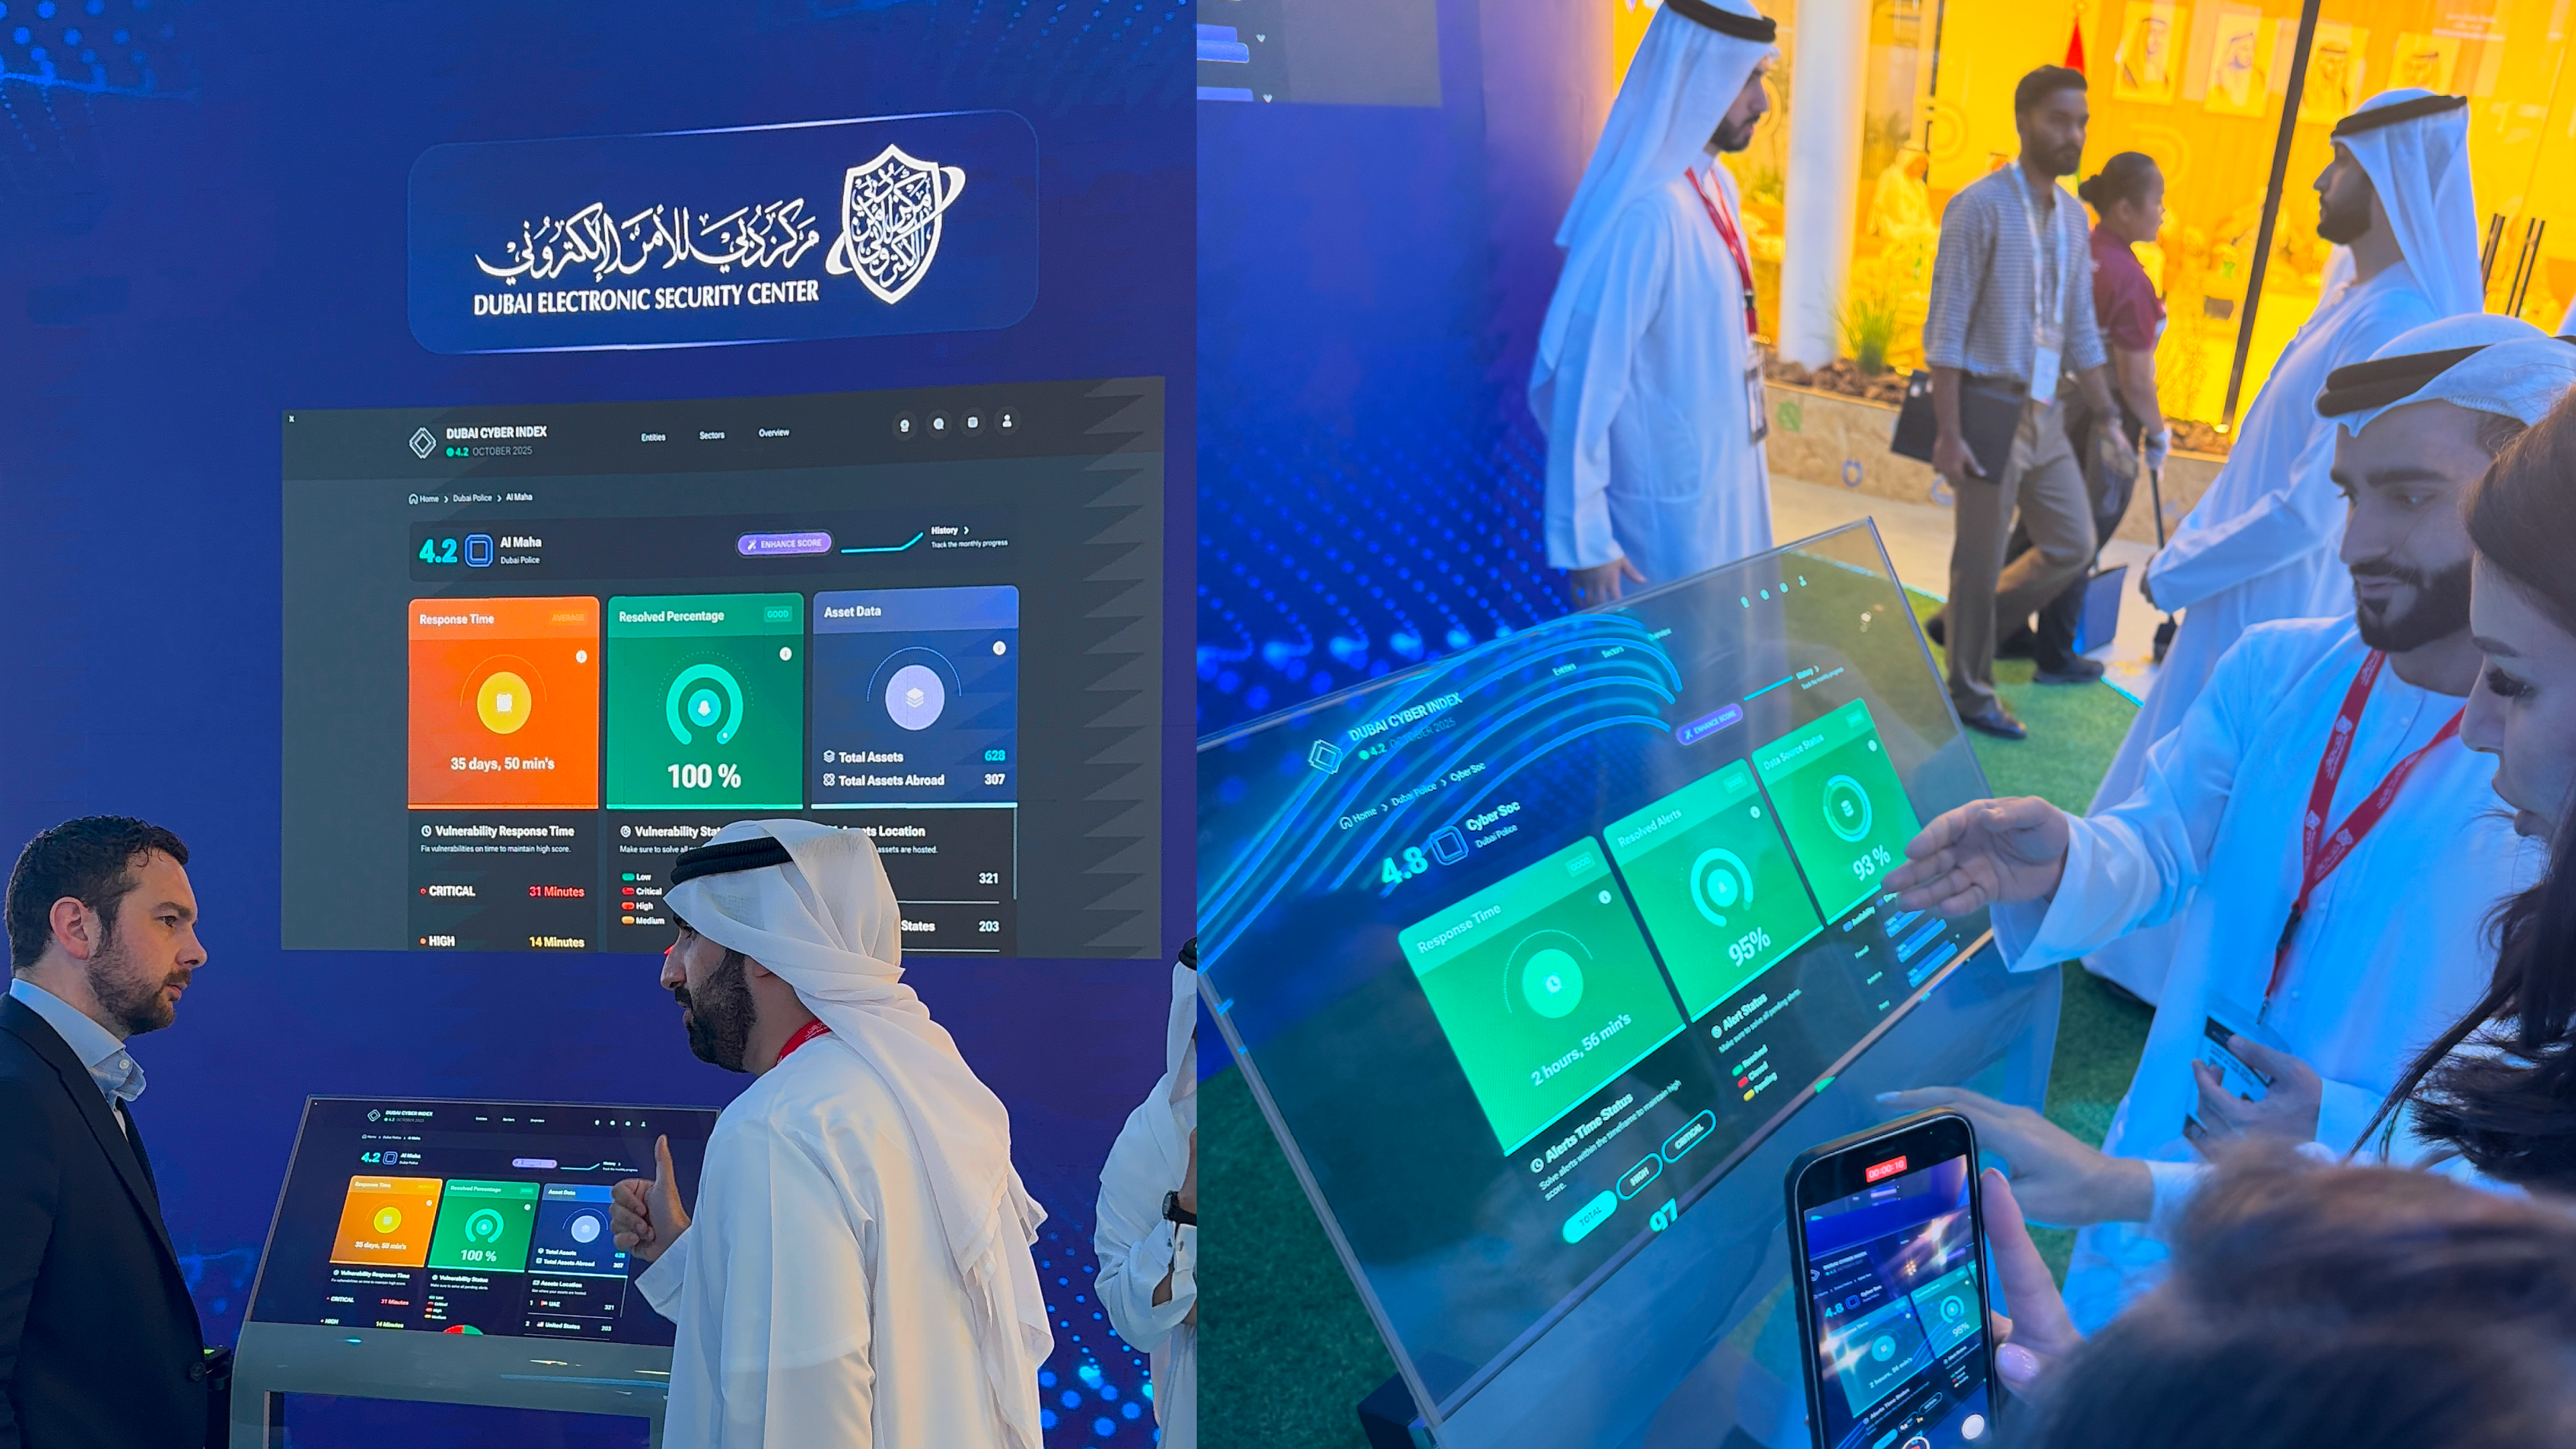
Shipped and in active use across Dubai's government entities, and presented at GITEX Global 2025.
man taking a photo on a wharf

GITEX Global 2025 — The platform on the DESC stand, on screen and on kiosk.
Design

Dubai Cyber Index

The Dubai Electronic Security Center measures the cyber maturity of every government entity in Dubai and publishes it as a single monthly score. The platform already existed, it needed a redesign and a much bigger feature set. I led design on the rebuild.

At a glance:

Role: Design Lead

Team: 2 designers, 4 developers, 1 product owner

Scope: Product strategy, UX, UI, design system, AI feature concept

Status: Shipped and in active use · Presented at GITEX Global 2025

man walking in front of textured wall

Entities — Every entity with its score and trend. Level and direction, without opening anything.

The problem

Two audiences with opposite needs. Leadership wants the health of the city in about three seconds. The entities themselves log in to find out precisely what to fix. Underneath sits the harder part: six independent security products — Cyber SOC, TIRS, Al Kashif, Taresh, Asaas, Al Maha each producing its own telemetry in its own units, collapsing into one number between 0 and 5. That number had to feel fair to whoever got a bad one. A score you don't trust is a score you ignore.

What I did

One number, then a way down. City score → entity → product → the individual alerts behind it. Every level answers the same two questions at a different resolution, so leadership stops at the top and a security team lives at the bottom.

Colour as the system. Good / Average / Poor drives the whole interface, designed as full variants rather than colour swaps. The tonal call mattered: every state resolves into a next action — "Solve 5 pending alerts within 1 hour" — so a poor score reads as a to-do list rather than a verdict.

Enhance Score. My proposal. The platform diagnosed well and prescribed nothing. This reads an entity's posture across all six products, returns prioritised plain-language recommendations, and opens into a conversation so the reasoning can be questioned.

A system, not a set of screens.

With four developers building in parallel against a design of this surface area, the system was the deliverable as much as the screens were.

  • 170 components, 2,825 instances — headers, product cards, score badges and status grades built once and reused everywhere
  • Semantic tokens for colour, a defined type scale, and named elevation, so score states and theming stay consistent by construction rather than by discipline
  • Five responsive breakpoints designed explicitly, from 576px phones to large command-centre displays
  • The unglamorous states, all of them — skeleton loading, empty states, no-data products, error and maintenance pages, invalid auth
  • Annotated hover and interaction specs written directly into the file for handoff

crowd of people on a town square

Entity dashboard — Current score, twelve-month trend, and the six products composing it. Where the single number becomes explainable.

crowd of people on a town square

Product dashboard — Cyber SOC — Response time, resolved alerts, data source coverage. Each carries its own state and its own next action.

crowd of people on a town square

Product dashboard — TIRS — Six products, six data shapes, one widget grammar.

man taking a photo on a wharf

Monitor — Every entity against every product. The densest screen, and the real test of the system.

man taking a photo on a wharf

Overview — Performance rolled up by product across the whole index.

man taking a photo on a wharf

Admin — User management, activity logs and audit trails behind the public-facing product.

Outcome

Shipped and in active use across Dubai's government entities, and presented at GITEX Global 2025.

man taking a photo on a wharf

GITEX Global 2025 — The platform on the DESC stand, on screen and on kiosk.

Design

Dubai Cyber Index

The Dubai Electronic Security Center measures the cyber maturity of every government entity in Dubai and publishes it as a single monthly score. The platform already existed, it needed a redesign and a much bigger feature set. I led design on the rebuild.

At a glance:

Role: Design Lead

Team: 2 designers, 4 developers, 1 product owner

Scope: Product strategy, UX, UI, design system, AI feature concept

Status: Shipped and in active use · Presented at GITEX Global 2025

man walking in front of textured wall

Entities — Every entity with its score and trend. Level and direction, without opening anything.

The problem

Two audiences with opposite needs. Leadership wants the health of the city in about three seconds. The entities themselves log in to find out precisely what to fix. Underneath sits the harder part: six independent security products — Cyber SOC, TIRS, Al Kashif, Taresh, Asaas, Al Maha each producing its own telemetry in its own units, collapsing into one number between 0 and 5. That number had to feel fair to whoever got a bad one. A score you don't trust is a score you ignore.

What I did

One number, then a way down. City score → entity → product → the individual alerts behind it. Every level answers the same two questions at a different resolution, so leadership stops at the top and a security team lives at the bottom.

Colour as the system. Good / Average / Poor drives the whole interface, designed as full variants rather than colour swaps. The tonal call mattered: every state resolves into a next action — "Solve 5 pending alerts within 1 hour" — so a poor score reads as a to-do list rather than a verdict.

Enhance Score. My proposal. The platform diagnosed well and prescribed nothing. This reads an entity's posture across all six products, returns prioritised plain-language recommendations, and opens into a conversation so the reasoning can be questioned.

A system, not a set of screens.

With four developers building in parallel against a design of this surface area, the system was the deliverable as much as the screens were.

  • 170 components, 2,825 instances — headers, product cards, score badges and status grades built once and reused everywhere
  • Semantic tokens for colour, a defined type scale, and named elevation, so score states and theming stay consistent by construction rather than by discipline
  • Five responsive breakpoints designed explicitly, from 576px phones to large command-centre displays
  • The unglamorous states, all of them — skeleton loading, empty states, no-data products, error and maintenance pages, invalid auth
  • Annotated hover and interaction specs written directly into the file for handoff

crowd of people on a town square

Entity dashboard — Current score, twelve-month trend, and the six products composing it. Where the single number becomes explainable.

crowd of people on a town square

Product dashboard — Cyber SOC — Response time, resolved alerts, data source coverage. Each carries its own state and its own next action.

crowd of people on a town square

Product dashboard — TIRS — Six products, six data shapes, one widget grammar.

man taking a photo on a wharf

Monitor — Every entity against every product. The densest screen, and the real test of the system.

man taking a photo on a wharf

Overview — Performance rolled up by product across the whole index.

man taking a photo on a wharf

Admin — User management, activity logs and audit trails behind the public-facing product.

Outcome

Shipped and in active use across Dubai's government entities, and presented at GITEX Global 2025.

man taking a photo on a wharf

GITEX Global 2025 — The platform on the DESC stand, on screen and on kiosk.